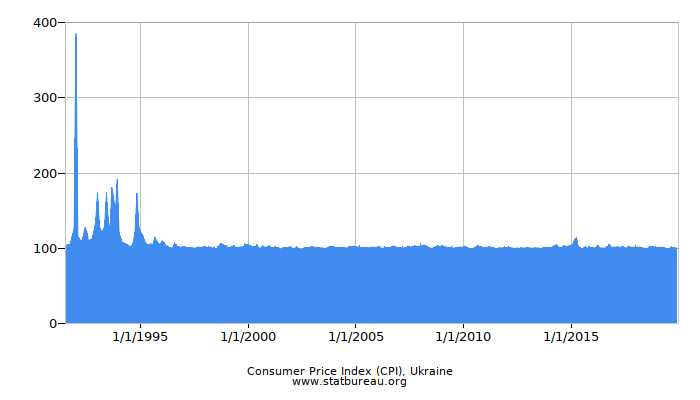
Consumer Price Index (CPI), Ukraine
Overview
Consumer Price Index in Ukraine is calculated and published by the State Statistics Service of Ukraine. The index is used to calculate inflation rate in Ukraine and is calculated since 1991.
The index is updated monthly, usually in the beginning of the month following the subject one and 100 corresponds to the beginning of the reported month.
Data
| Year | Jan | Feb | Mar | Apr | May | Jun | Jul | Aug | Sep | Oct | Nov | Dec |
|---|---|---|---|---|---|---|---|---|---|---|---|---|
| 2019 | 101.0 | 100.5 | 100.9 | 101.0 | 100.7 | 99.5 | 99.4 | 99.7 | 100.7 | 100.7 | 100.1 | 99.8 |
| 2018 | 101.5 | 100.9 | 101.1 | 100.8 | 100.0 | 100.0 | 99.3 | 100.0 | 101.9 | 101.7 | 101.4 | 100.8 |
| 2017 | 101.1 | 101.0 | 101.8 | 100.9 | 101.3 | 101.6 | 100.2 | 100 | 102.0 | 101.2 | 100.9 | 101.0 |
| 2016 | 100.9 | 99.6 | 101.0 | 103.5 | 100.1 | 99.8 | 99.9 | 99.7 | 101.8 | 102.8 | 101.8 | 100.9 |
| 2015 | 103.1 | 105.3 | 110.8 | 114.0 | 102.2 | 100.4 | 99.0 | 99.2 | 102.3 | 98.7 | 102.0 | 100.7 |
| 2014 | 100.2 | 100.6 | 102.2 | 103.3 | 103.8 | 101.0 | 100.4 | 100.8 | 102.9 | 102.4 | 101.9 | 103.0 |
| 2013 | 100.2 | 99.9 | 100.0 | 100.0 | 100.1 | 100.0 | 99.9 | 99.3 | 100.0 | 100.4 | 100.2 | 100.5 |
| 2012 | 100.2 | 100.2 | 100.3 | 100.0 | 99.7 | 99.7 | 99.8 | 99.7 | 100.1 | 100.0 | 99.9 | 100.2 |
| 2011 | 101.0 | 100.9 | 101.4 | 101.3 | 100.8 | 100.4 | 98.7 | 99.6 | 100.1 | 100.0 | 100.1 | 100.2 |
| 2010 | 101.8 | 101.9 | 100.9 | 99.7 | 99.4 | 99.6 | 99.8 | 101.2 | 102.9 | 100.5 | 100.3 | 100.8 |
| 2009 | 102.9 | 101.5 | 101.4 | 100.9 | 100.5 | 101.1 | 99.9 | 99.8 | 100.8 | 100.9 | 101.1 | 100.9 |
| 2008 | 102.9 | 102.7 | 103.8 | 103.1 | 101.3 | 100.8 | 99.5 | 99.9 | 101.1 | 101.7 | 101.5 | 102.1 |
| 2007 | 100.5 | 100.6 | 100.2 | 100.0 | 100.6 | 102.2 | 101.4 | 100.6 | 102.2 | 102.9 | 102.2 | 102.1 |
| 2006 | 101.2 | 101.8 | 99.7 | 99.6 | 100.5 | 100.1 | 100.9 | 100.0 | 102.0 | 102.6 | 101.8 | 100.9 |
| 2005 | 101.7 | 101.0 | 101.6 | 100.7 | 100.6 | 100.6 | 100.3 | 100.0 | 100.4 | 100.9 | 101.2 | 100.9 |
| 2004 | 101.4 | 100.4 | 100.4 | 100.7 | 100.7 | 100.7 | 100.0 | 99.9 | 101.3 | 102.2 | 101.6 | 102.4 |
| 2003 | 101.5 | 101.1 | 101.1 | 100.7 | 100.0 | 100.1 | 99.9 | 98.3 | 100.6 | 101.3 | 101.9 | 101.5 |
| 2002 | 101.0 | 98.6 | 99.3 | 101.4 | 99.7 | 98.2 | 98.5 | 99.8 | 100.2 | 100.7 | 100.7 | 101.4 |
| 2001 | 101.5 | 100.6 | 100.6 | 101.5 | 100.4 | 100.6 | 98.3 | 99.8 | 100.4 | 100.2 | 100.5 | 101.6 |
| 2000 | 104.6 | 103.3 | 102.0 | 101.7 | 102.1 | 103.7 | 99.9 | 100.0 | 102.6 | 101.4 | 100.4 | 101.6 |
| 1999 | 101.5 | 101.0 | 101.0 | 102.3 | 102.4 | 100.1 | 99.0 | 101.0 | 101.4 | 101.1 | 102.9 | 104.1 |
| 1998 | 101.3 | 100.2 | 100.2 | 101.3 | 100.0 | 100.0 | 99.1 | 100.2 | 103.8 | 106.2 | 103.0 | 103.3 |
| 1997 | 102.2 | 101.2 | 100.1 | 100.8 | 100.8 | 100.1 | 100.1 | 100.0 | 101.2 | 100.9 | 100.9 | 101.4 |
| 1996 | 109.4 | 107.4 | 103.0 | 102.4 | 100.7 | 100.1 | 100.1 | 105.7 | 102.0 | 101.5 | 101.2 | 100.9 |
| 1995 | 121.2 | 118.1 | 111.4 | 105.8 | 104.6 | 104.8 | 105.2 | 104.6 | 114.2 | 109.1 | 106.2 | 104.6 |
| 1994 | 119.2 | 112.6 | 105.7 | 106.0 | 105.2 | 103.9 | 102.1 | 102.6 | 107.3 | 122.6 | 172.3 | 128.4 |
| 1993 | 173.2 | 128.8 | 122.1 | 123.6 | 127.6 | 171.7 | 137.6 | 121.7 | 180.3 | 166.1 | 145.3 | 190.8 |
| 1992 | 385.2 | 115.3 | 112.1 | 107.6 | 114.4 | 126.5 | 122.1 | 108.3 | 110.6 | 112.4 | 122.0 | 135.1 |
| 1991 | 104.0 | 104.5 | 105.9 | 116.5 | 124.6 |

Index data was last modified on 27 Jan 2020