Inflation Rate
Overview
Inflation is the change of the price for the set of services and products within some period and of the country currency purchasing power on the internal market. It is one of the most important characteristics of the country economy, a key attribute of the economy health. Both - high inflation, hyperinflation and low inflation, deflation - are usually signals for various issues with the country economy.
Government of every advanced country with the market economy system calculates, tracks and monitors the inflation rate on a regular basis as it represents the activities and processes going on in the society, very often as a reaction, feedback to government policies and actions.
Most Recent Data
| Country | Month | Inflation MOM, % | Inflation YOY, % | Inflation YTD, % |
|---|---|---|---|---|
| Belarus | January 2019 | 0.88 | 5.78 | 0.88 |
| Brazil | January 2019 | 0.32 | 3.78 | 0.32 |
| Canada | December 2018 | -0.07 | 1.99 | 1.99 |
| European Union | December 2020 | 0.32 | 0.25 | 0.25 |
| Eurozone | December 2020 | 0.33 | -0.27 | -0.27 |
| France | January 2019 | -0.47 | 1.21 | -0.47 |
| Germany | December 2020 | 0.48 | -0.28 | -0.28 |
| Greece | January 2019 | -1.77 | 0.44 | -1.77 |
| India | December 2018 | -0.33 | 5.24 | 5.24 |
| Japan | November 2020 | -0.49 | -0.98 | -0.98 |
| Kazakhstan | January 2019 | 0.50 | 5.32 | 0.50 |
| Mexico | July 2018 | 0.54 | 4.81 | 1.66 |
| Russia | January 2026 | 1.62 | 6.01 | 1.62 |
| Spain | January 2019 | -1.28 | 0.98 | -1.28 |
| Turkey | January 2019 | 1.06 | 20.35 | 1.06 |
| Ukraine | December 2019 | -0.20 | 4.05 | 4.05 |
| United Kingdom | December 2018 | 0.09 | 2.10 | 2.10 |
| United States | December 2020 | 0.09 | 1.36 | 1.36 |
MOM - Month over month, 1 month
YOY - Year over year, last 12 months
YTD - Year to date, from the beginning of the year
Most recent Year to Year Inflation rates across the globe. To compare countries inflation rates by years, please visit the Country Rankings by Inflation page.


Country rankings by inflation in 2026 are available on the site as well as for 2025 and other years.
Notes
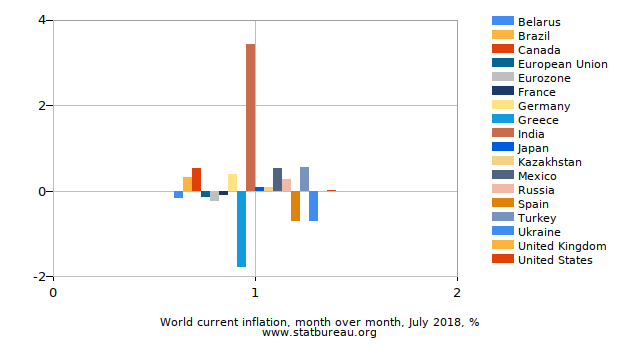
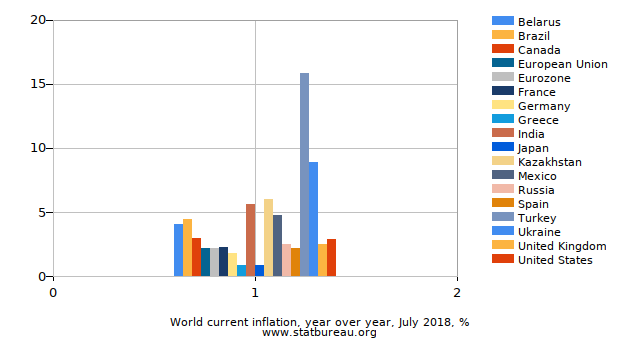
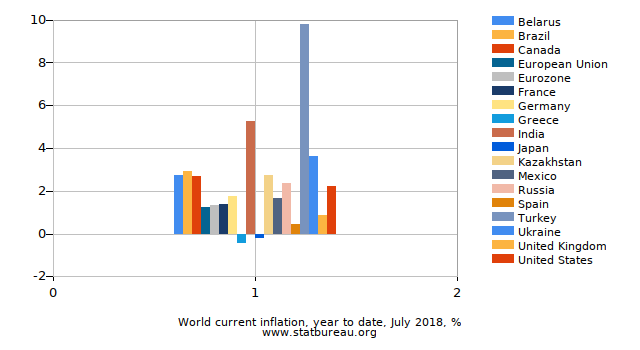
Different countries publish inflation statistics at different times. As a result, the table above shows the most recent data published, while the chart shows the data for the month common to all countries to make sure the comparison is more accurate. To create and run more complex inflation comparison reports between different countries for various periods, visit the Inflation Comparison page.
To learn more about specific country inflation including most recent data, historical inflation, charts, data source information, web services api and widget examples, please visit the respective page by following the country name link.