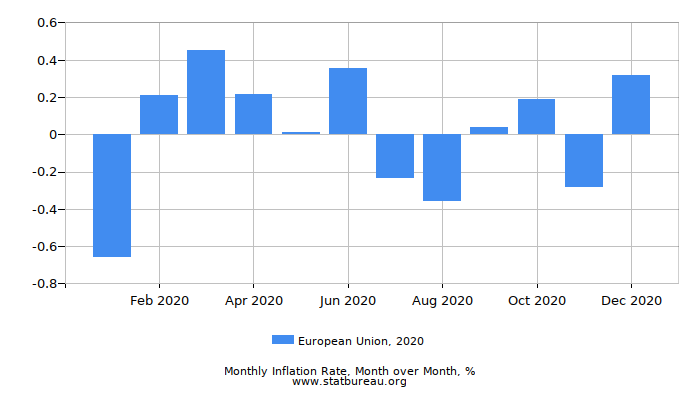
Inflation Rate in the European Union, 2020
Overview
Monthly inflation rate in the European Union was 0.32% in December 2020. That is 0.60 more than it was in November 2020 and 0.05 more than in December 2019. At the same time, 2020 year to date inflation rate is 0.25% and year over year inflation rate is 0.25%.
In 2020 EU ranks #4 in the world by yearly inflation rate.
European Union is a union of 28 european countries which, unlike those in Euro Area, are able to use their own currencies and not only Euro.
Inflation in European Union is calculated based on the Harmonized Index of Consumer Prices (HICP), more specifically European Index of Consumer Prices (EICP) that includes both - countries from the Eurozone and Member States.
Consumer Prices are representing the prices that the end consumer has to pay for the product or service together with all taxes and fees and the indexes are calculated since 1996.
Current Inflation Rate
|
Inflation rate in December 2020:
(month over month, MOM)
| 0.32% |
| Inflation rate year to date, YTD: | 0.25% |
| Inflation rate in November 2020, MOM: | -0.28% |
| Inflation rate in December 2019, MOM: | 0.27% |
| Inflation rate in December 2019, YTD: | 1.57% |
| Inflation rate in 2019: | 1.57% |
| Last 12 months inflation rate:
(year over year, YOY)
| 0.25% |
| Last 60 months inflation rate (5 years): | 6.39% |
| Last 120 months inflation rate (10 years): | 13.41% |
Month over month inflation rate is calculated for just the subject month itself - from the first to the last day of that month:
| Jan | Feb | Mar | Apr | May | Jun | Jul | Aug | Sep | Oct | Nov | Dec | Total | |
|---|---|---|---|---|---|---|---|---|---|---|---|---|---|
| Month to month, % | -0.66 | 0.21 | 0.45 | 0.22 | 0.01 | 0.36 | -0.23 | -0.36 | 0.04 | 0.19 | -0.28 | 0.32 | 0.25 |

Year to year inflation rate is calculated for 12 months: 11 months preceding the subject one and the subject month itself:
| Jan | Feb | Mar | Apr | May | Jun | Jul | Aug | Sep | Oct | Nov | Dec | Total | |
|---|---|---|---|---|---|---|---|---|---|---|---|---|---|
| Year over year (12 months), % | 1.74 | 1.58 | 1.23 | 0.75 | 0.56 | 0.81 | 0.87 | 0.38 | 0.25 | 0.32 | 0.21 | 0.25 | 0.25 |

Progressive inflation rate is an incremental year to date inflation that sums rates from the beginning of the calendar year to the end of the subject month:
| Jan | Feb | Mar | Apr | May | Jun | Jul | Aug | Sep | Oct | Nov | Dec | Total | |
|---|---|---|---|---|---|---|---|---|---|---|---|---|---|
| Progressive (year to date), % | -0.66 | -0.45 | 0.00 | 0.22 | 0.23 | 0.58 | 0.35 | -0.01 | 0.03 | 0.22 | -0.07 | 0.25 | 0.25 |

More Info
There are more resources available about the inflation in the European Union:
 Tables of current and historical inflation rates in the European Union by months and years
 Monthly charts showing month over month inflation
 Monthly charts showing year over year inflation rates
 Yearly - charts of annual inflation
 Comparison charts that allow custom reports for any given period and to compare inflation rates between countries and years
 Calculators that allow calculating inflation rates, price and money purchasing power changes for custom periods
Hotlinking and Charts Reusing
All charts are regularly updated and can be hotlinked and used within third party web sites and blogs under a set of conditions. Also charts support parameters that help adjust the charts look and feel. For details on parameters and usage conditions please refer to the Charts API page.
About Data
All data and calculations are based on the official Consumer Price Indexes published monthly by the Eurostat, statistical service of the European Commission.
Inflation data in EU is published in two phases: on the first few days of the month the flash estimate is released and more detailed report is published in the middle of the month, rounded to two decimal digits.