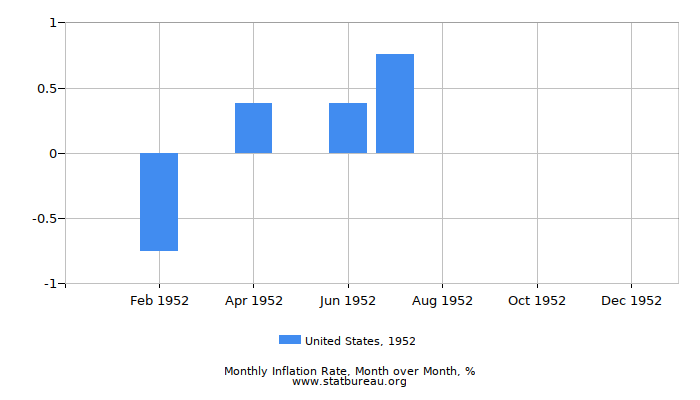
United States Inflation Rate in 1952
Inflation rate in the United States was 0.75% in 1952. That is 5.25 less than it was in the preceding 1951 and the same as in the following 1953.
Month over month inflation rate is calculated for just the subject month itself - from the first to the last day of that month:
| Jan | Feb | Mar | Apr | May | Jun | Jul | Aug | Sep | Oct | Nov | Dec | Total | |
|---|---|---|---|---|---|---|---|---|---|---|---|---|---|
| Month to month, % | 0.00 | -0.75 | 0.00 | 0.38 | 0.00 | 0.38 | 0.75 | 0.00 | 0.00 | 0.00 | 0.00 | 0.00 | 0.75 |

Year to year inflation rate is calculated for 12 months: 11 months preceding the subject one and the subject month itself:
| Jan | Feb | Mar | Apr | May | Jun | Jul | Aug | Sep | Oct | Nov | Dec | Total | |
|---|---|---|---|---|---|---|---|---|---|---|---|---|---|
| Year over year (12 months), % | 4.33 | 2.33 | 1.94 | 2.33 | 1.93 | 2.32 | 3.09 | 3.09 | 2.30 | 1.91 | 1.14 | 0.75 | 0.75 |

Progressive inflation rate is an incremental year to date inflation that sums rates from the beginning of the calendar year to the end of the subject month:
| Jan | Feb | Mar | Apr | May | Jun | Jul | Aug | Sep | Oct | Nov | Dec | Total | |
|---|---|---|---|---|---|---|---|---|---|---|---|---|---|
| Progressive (year to date), % | 0.00 | -0.75 | -0.75 | -0.38 | -0.38 | 0.00 | 0.75 | 0.75 | 0.75 | 0.75 | 0.75 | 0.75 | 0.75 |

Hotlinking and Charts Reusing
All charts are regularly updated and can be hotlinked and used within third party web sites and blogs under a set of conditions. Also charts support parameters that help adjust the charts look and feel. For details on parameters and usage conditions please refer to the Charts API page.