United States Inflation Rate in 2025
Inflation rate in the United States was 2.68% in 2025. That is 0.21 less than it was in the preceding 2024 and 0.69% less than in the following year of 2026.
In 2025 USA ranked #1 in the world by yearly inflation rate.
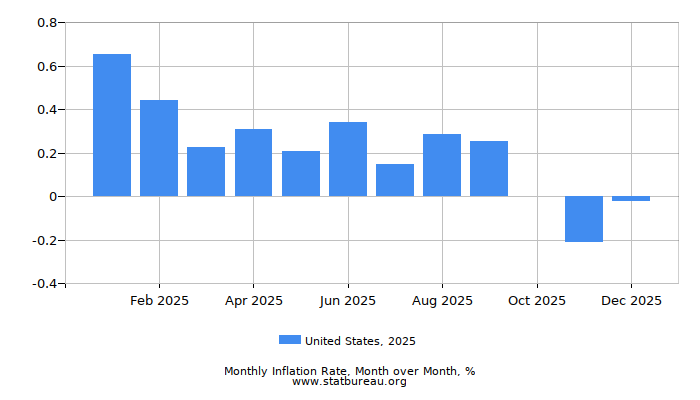
Month over month inflation rate is calculated for just the subject month itself - from the first to the last day of that month:
| Jan | Feb | Mar | Apr | May | Jun | Jul | Aug | Sep | Oct | Nov | Dec | Total | |
|---|---|---|---|---|---|---|---|---|---|---|---|---|---|
| Month to month, % | 0.65 | 0.44 | 0.22 | 0.31 | 0.21 | 0.34 | 0.15 | 0.29 | 0.25 | 0.00 | -0.21 | -0.02 | 2.68 |
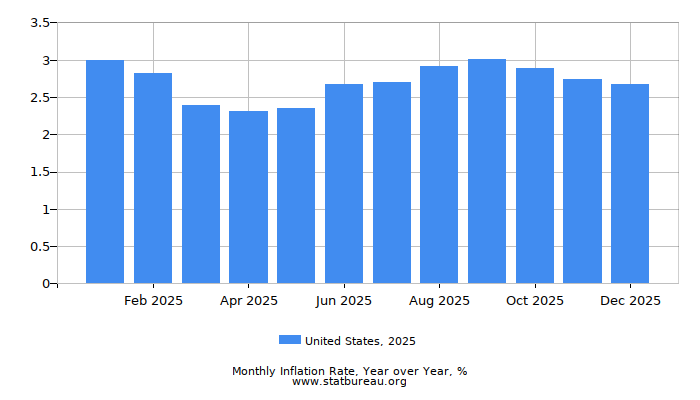
Year to year inflation rate is calculated for 12 months: 11 months preceding the subject one and the subject month itself:
| Jan | Feb | Mar | Apr | May | Jun | Jul | Aug | Sep | Oct | Nov | Dec | Total | |
|---|---|---|---|---|---|---|---|---|---|---|---|---|---|
| Year over year (12 months), % | 3.00 | 2.82 | 2.39 | 2.31 | 2.35 | 2.67 | 2.70 | 2.92 | 3.01 | 2.89 | 2.74 | 2.68 | 2.68 |
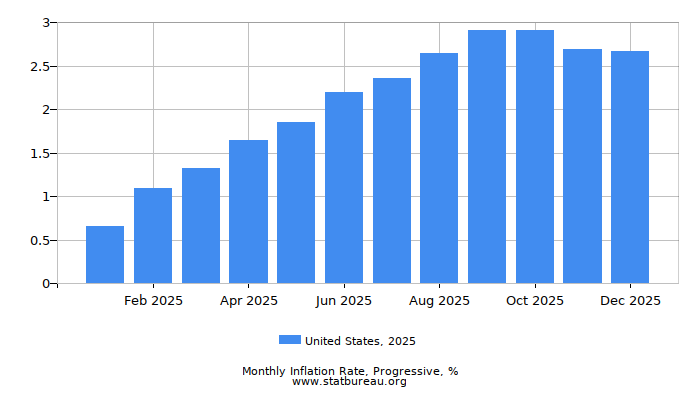
Progressive inflation rate is an incremental year to date inflation that sums rates from the beginning of the calendar year to the end of the subject month:
| Jan | Feb | Mar | Apr | May | Jun | Jul | Aug | Sep | Oct | Nov | Dec | Total | |
|---|---|---|---|---|---|---|---|---|---|---|---|---|---|
| Progressive (year to date), % | 0.65 | 1.10 | 1.33 | 1.64 | 1.86 | 2.20 | 2.36 | 2.65 | 2.91 | 2.91 | 2.70 | 2.68 | 2.68 |
Hotlinking and Charts Reusing
All charts are regularly updated and can be hotlinked and used within third party web sites and blogs under a set of conditions. Also charts support parameters that help adjust the charts look and feel. For details on parameters and usage conditions please refer to the Charts API page.